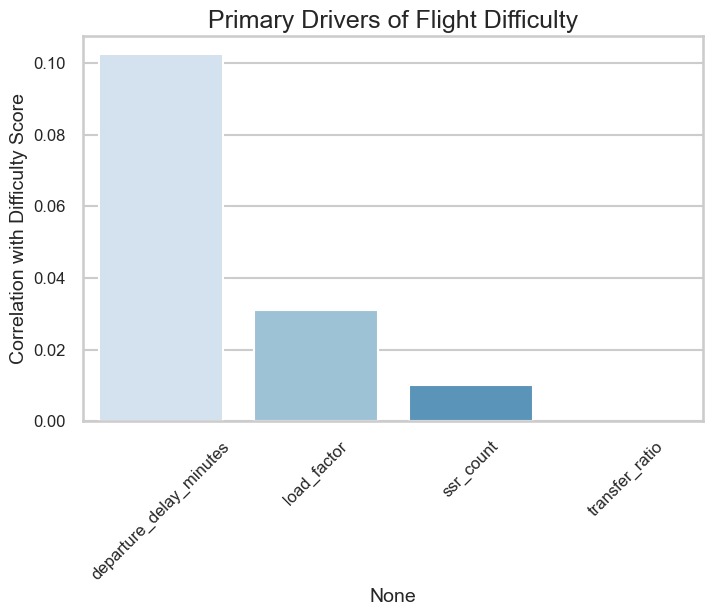
Primary Drivers of Flight Difficulty
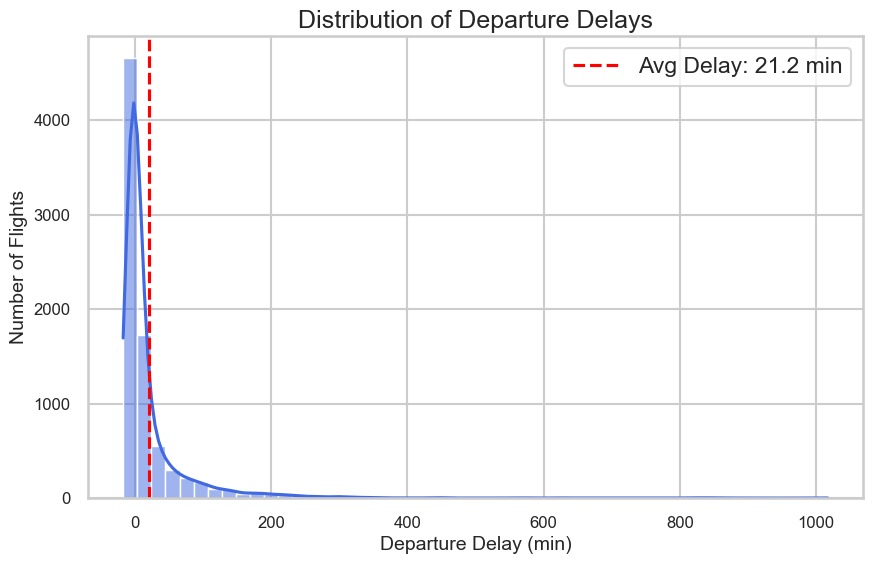
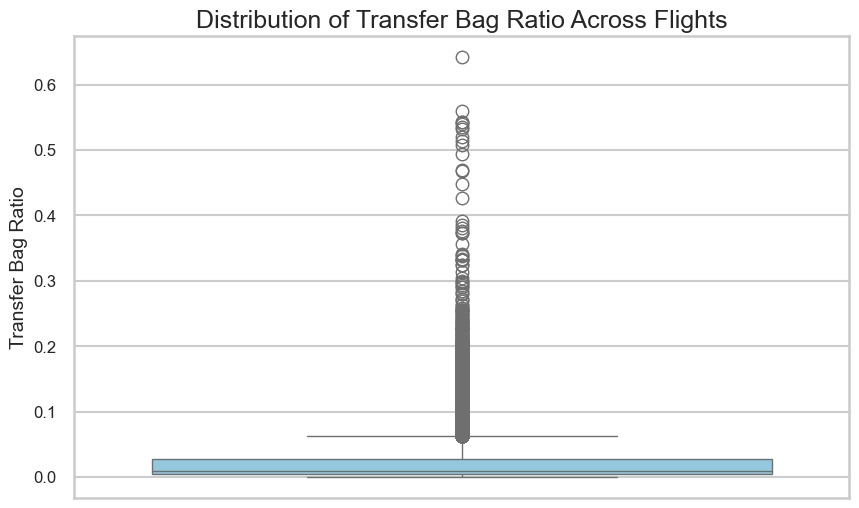
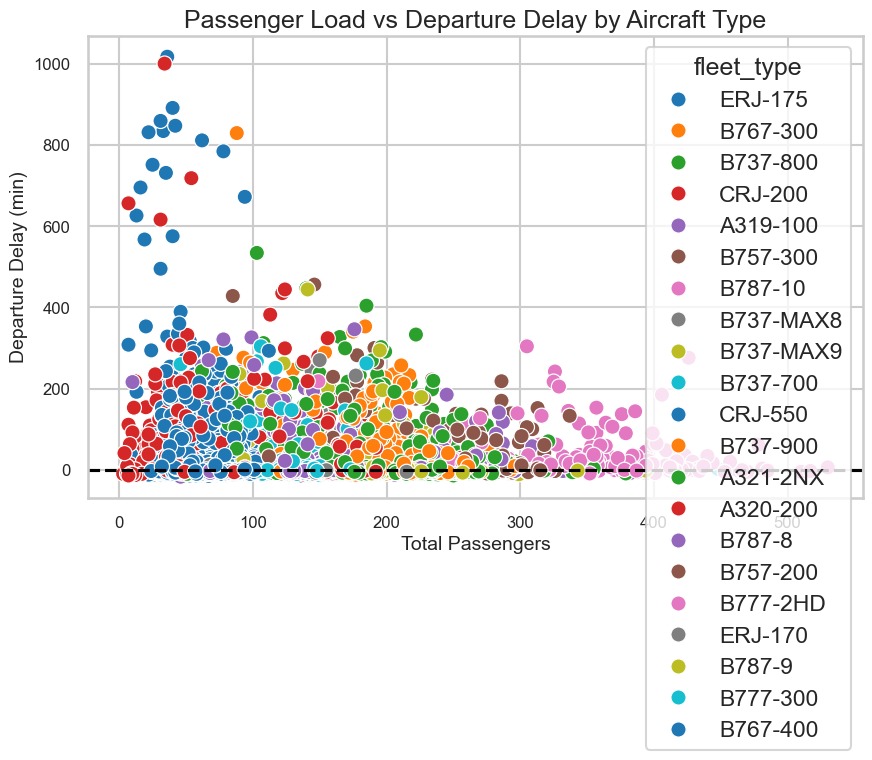
Correlation of Features with Difficulty Score: departure_delay_minutes (0.10) > load_factor (0.08) > ssr_count (0.02) > transfer_ratio (0.00)
- TOP DIFFICULT DESTINATIONS
LHR, HND, SFO, SEA, IAD → highest operational difficulty.
Mostly long-haul international and busy domestic hubs with complex turnaround ops.
- MAJOR PATTERNS
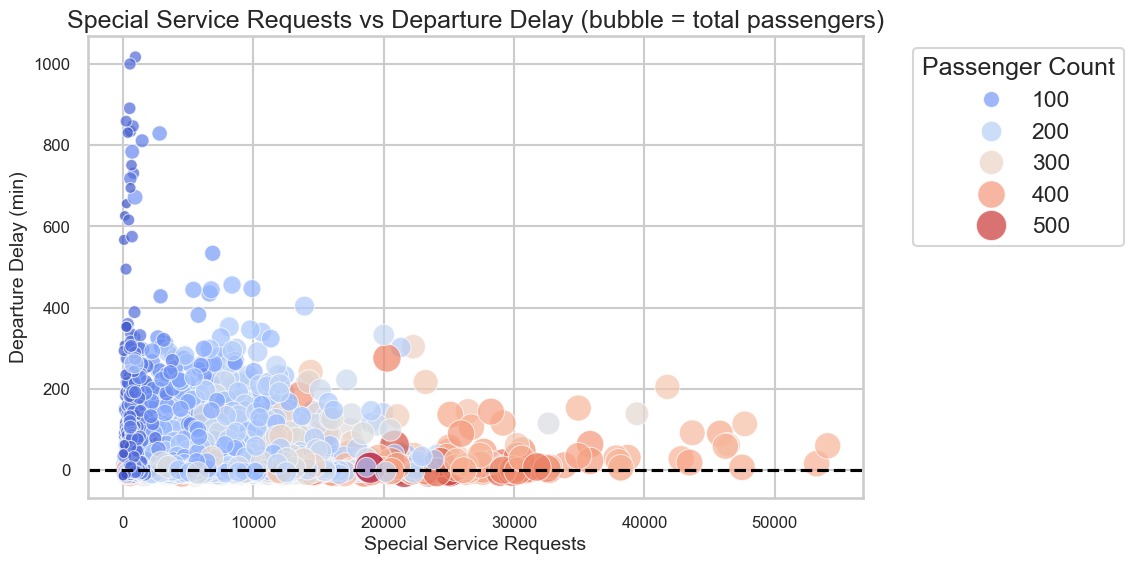
Delays → High Load correlation → dual pressure on teams.
International routes show higher difficulty (ground time + baggage + SSRs).
More transfer bags/SSRs → higher operational coordination effort.
- ACTIONABLE INSIGHTS
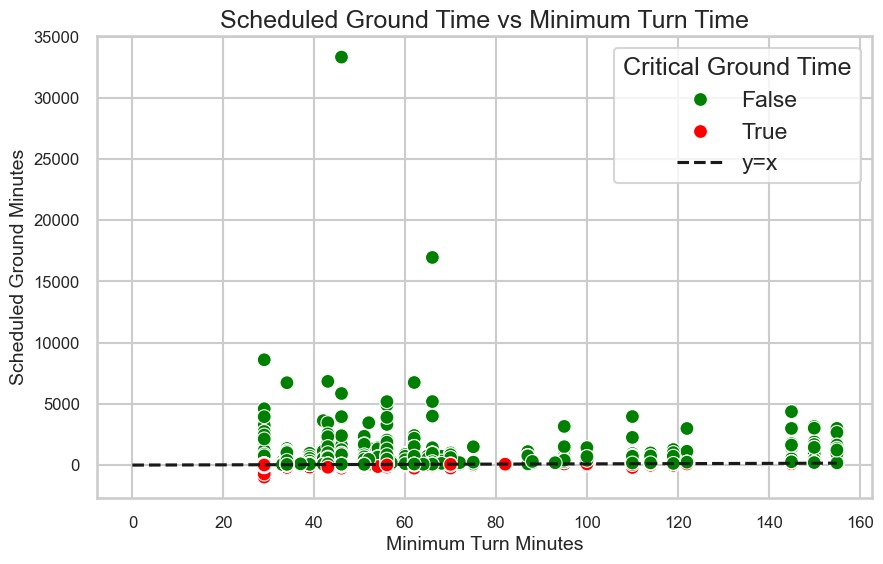
Delays → Add buffer turnaround time, backup crew.
Load Factor → Strengthen boarding & check-in staff.
Transfer Bags → Assign extra baggage handlers.
SSRs → Dedicated staff for assistance services.
Difficult Destinations → Pre-boarding checks, contingency planning.